Friday I mentioned that the Noem-Thune-GOP line that "we have a taxing problem, not a spending problem" is not supported by the fact President Barack Obama has taken less of your paycheck for federal taxes than any President since Eisenhower.
Kevin Drum of Mother Jones shares this chart on total government spending that shows once again that, contrary to Republican shouting, government has gotten smaller under President Obama:
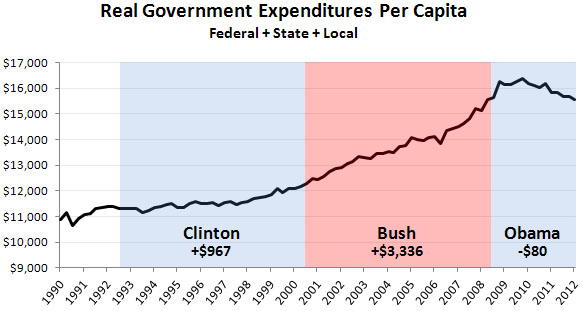
If you add up federal, state, and local government spending, you find government is spending less per American now than it did at the beginning of President Barack Obama's first term. We've erased the stimulus, unlike the Bush Administration, which kept ramping up government spending and thus boosting employment and GDP even after the 2001 recession faded.
Kevin Drum sums up the fiscal-policy message Republicans don't want you to hear:
What we have isn't a spending problem. That's under control. What we have is a problem with Republicans not wanting to pay the bills they themselves were largely responsible for running up [Kevin Drum, "Government Spending Is Down in the Obama Era," Mother Jones, 2013.01.22].
Our spending is not out of control. Republican rhetoric and irresponsibility is.
Update 07:19 MST: As Rep. Kristi Noem shouts about the need for Washington (which she keeps referring to as if she were not a part of it) to offer real policy solutions, she dedicates her newest weekly column to urging you to get your flu shot.
Spending per capita may be down, but according to S.D. Sen. John Thune's presentation earlier this month, what we have is a revenue vs. expenses problem. Right now the federal government is borrowing one third of the money it needs to pay expenses related to the operation of government offices, medical programs and national defense.
I don't know what's worse. Republicans wanting to borrow from China and future generations to pay for today's spending instead of taxing today to pay for today's spending. Or the GOP's new position, which is to neither tax nor borrow, but to default on bills instead of paying them. You just can't trust Republicans with economic decisions.
The government had a spending problem long before Obama got into office.
We have a "debt" problem. Now look at the debt as % of GDP and see that it was the Federal Reserve Act of 1913 where that problem got out of control, regardless of which party was ion control. And the Establishmetn's of both parties want to protect the federal reserve system. It takes an objective independent thinking person to understand that both parties are the problem, neither is the solution.
http://www.usgovernmentspending.com/federal_debt_chart.html
Take a look at this chart:
http://www.google.com/imgres?q=chart+federal+revenue&hl=en&sa=X&tbo=d&biw=1024&bih=661&tbm=isch&tbnid=V5QAdM5tU6fLKM:&imgrefurl=http://www.heritage.org/federalbudget/growth-federal-spending-revenue&docid=TDtoZQ4YXr11-M&imgurl=http://www.heritage.org/federalbudget/charts/2012/growth-federal-spending-revenue-680.jpg&w=680&h=481&ei=_xEAUdeeG8bmqAGh5oHIAQ&zoom=1&iact=rc&dur=267&sig=104588776094696249098&page=1&tbnh=136&tbnw=192&start=0&ndsp=18&ved=1t:429,r:5,s:0,i:99&tx=130&ty=82
Hrm, so total government spending per capita start of Bush II was just above $12,000. Now, at the beginning of President Obama's 2nd term, we're spending about $15,500 per capita.
Looks like spending was pretty steady til the end of the Clinton era. I would, at first blush, say we started increasing our spending around 1998.
So Clinton, Bush II, & Obama all saw increased spending on their watch.
So how is it not a spending problem if our expenditures increase for 12 years straight at a rate above inflation? (can we get this chart adjusted for inflation?)
I'm willing to talk about revenue issues with the Bush Tax Cuts (now made permanent), but when spending has been consistently above what those taxes would have brought in, then we're again talking a spending problem.
Elisa: SD has a spending problem - we spend 1/3 more or 53%+ more than we bring in revenue. So please don't lecture about the feds until you're ready to cut state expenses and increase taxes. What are you telling our congress-critters to cut; which of SD's federal welfare should we do without? You think Thune's about to cut EAFB? or bloated farm subsidies? etc., then we have dorm at Vermillion we could sell you.
Obama's the best republican president the US has had since Eisenhower.
loved what Maddow said on her show tonight about this...
“These guys were not mad about George W. Bush’s big spike in spending, but they have decided to get really mad at the guy who is fixing that, and that anger is weird enough on its own terms. It’s weird enough that this Republican analysis of this problem is so divorced from reality. But what today’s news reminded us of is it’s not just the analysis that is weird, it’s also the purpose of the analysis, what they are using this cockamamie backwards analysis to justify that is really deeply strange.”
In other words, when the GOP tells you that this President is spending more money than you can imagine.....don't buy it.
Wayne, reread that negative sign in front of Obama's number on the chart.
Note also that Clinton's 8-year increase was 9%, Bush's was 27%. Obama's so far is –1%. Once again, it's empirical evidence that we get more restrained growth in government from Democratic Presidents than from Republican Presidents.
Ah, I see. Thanks for the clarification.
n = 3 is hardly a convincing sample size, Cory, for making sweeping generalizations about who's better for restrained government. For starters, we should examine whether the party of the president matched that of the legislature. We should compare when significant wars were taking place, etc.
We also shouldn't be attributing spending increases or decreases outside the purview of the office of the president. Mr. Obama has little direct control of the taxing & spending authority of South Dakota, let alone Madison.
I'm happy our spending is going in the right direction. Kudos to the President and our dysfunctional congress.
However, I think these graphs are especially illuminating:
1) Federal Spending per Household
2) Federal Spending Compared to Household Income
We have consistently been growing government spending at a blinding rate compared to what we make. It would be one thing if that spending had actually helped spur our income to grow commensurately, but it hasn't. We spend 70 percent of our budget on programs to help our society - Medicare, Medicaid, Social Security, farm subsidies, housing subsidies, etc. Yet we don't see improvements.
Bellowing for more revenue hardly seems the answer.
In what industry would we say it's okay to spend 290% more over baseline to increase outcomes by 25%? Teaching? Farming? Healthcare? Would you spend 290% more than your Jeep for a car that was only 25% more fuel efficient?
Another factor that must be taken into account with this chart is the federal budget. FY2011 and FY2012 show the current downhill trend for expenditures per capita. FY2012 had appropriation bills passed well into the fiscal year, and was not what could be consider an actual budget. FY2011 had continuing resolutions in in place of a budget.
Wayne, is the data you're linking to the same Heritage Foundation that designed and promoted the foundations of Obamacare? ;-)
It's from the Heritage Foundation, yes. And you can feel the slant in the titles.
However, the data is the data. If the graphs are factually inacurate, we have an issue, but otherwise it doesn't matter who made them, or what agenda they're pushing. Do you have reason to dispute their accuracy? (If so, perhaps you should have said so when Cory used them )
I highly encourage you to look through those graphs, examine them with a critical eye, and tell me if they're useful or not for having informed discussion about policy.
n = 3... yes, I too would ask for larger samples. But when we're talking presidential politics, we don't have larger samples. But I can unreservedly claim that I effectively disprove the thesis Republicans peddle about their fiscal conservatism. Counterexamples are wonderful things.
Certainly it is unwise to perpetually spend more than we take in... although in the strange world of national fiscal policy, it appears not to be as harmful as it is at the kitchen-table level... or at least the harm doesn't kick in nearly as soon. But the hard fact is that everyone who claims there's some big-government/socialist revolution afoot is wrong. Government as an expenditure person in this country over the last four years has shrunk, not grown.
Thanks Wayne, I have looked at them and besides being good discussion starters they seem to support the Heritage Foundation's "Saving the American Dream" plan and inspired "Fix-the-Debt" campaign.
It would be interesting to see what other charts and data points could be included to give maybe...just maybe...a little more information for debate.
Here's a chart that should be included in that debate.
http://www.washingtonpost.com/blogs/ezra-klein/files/2012/08/Debt-graph-CBPP.jpeg
Here's some insight as to who's dream is saved and who will sacrifice.
http://jonathanturley.org/2012/12/10/what-you-should-know-about-the-campaign-to-fix-the-debt-and-the-ceos-involved-in-deficit-talks/